
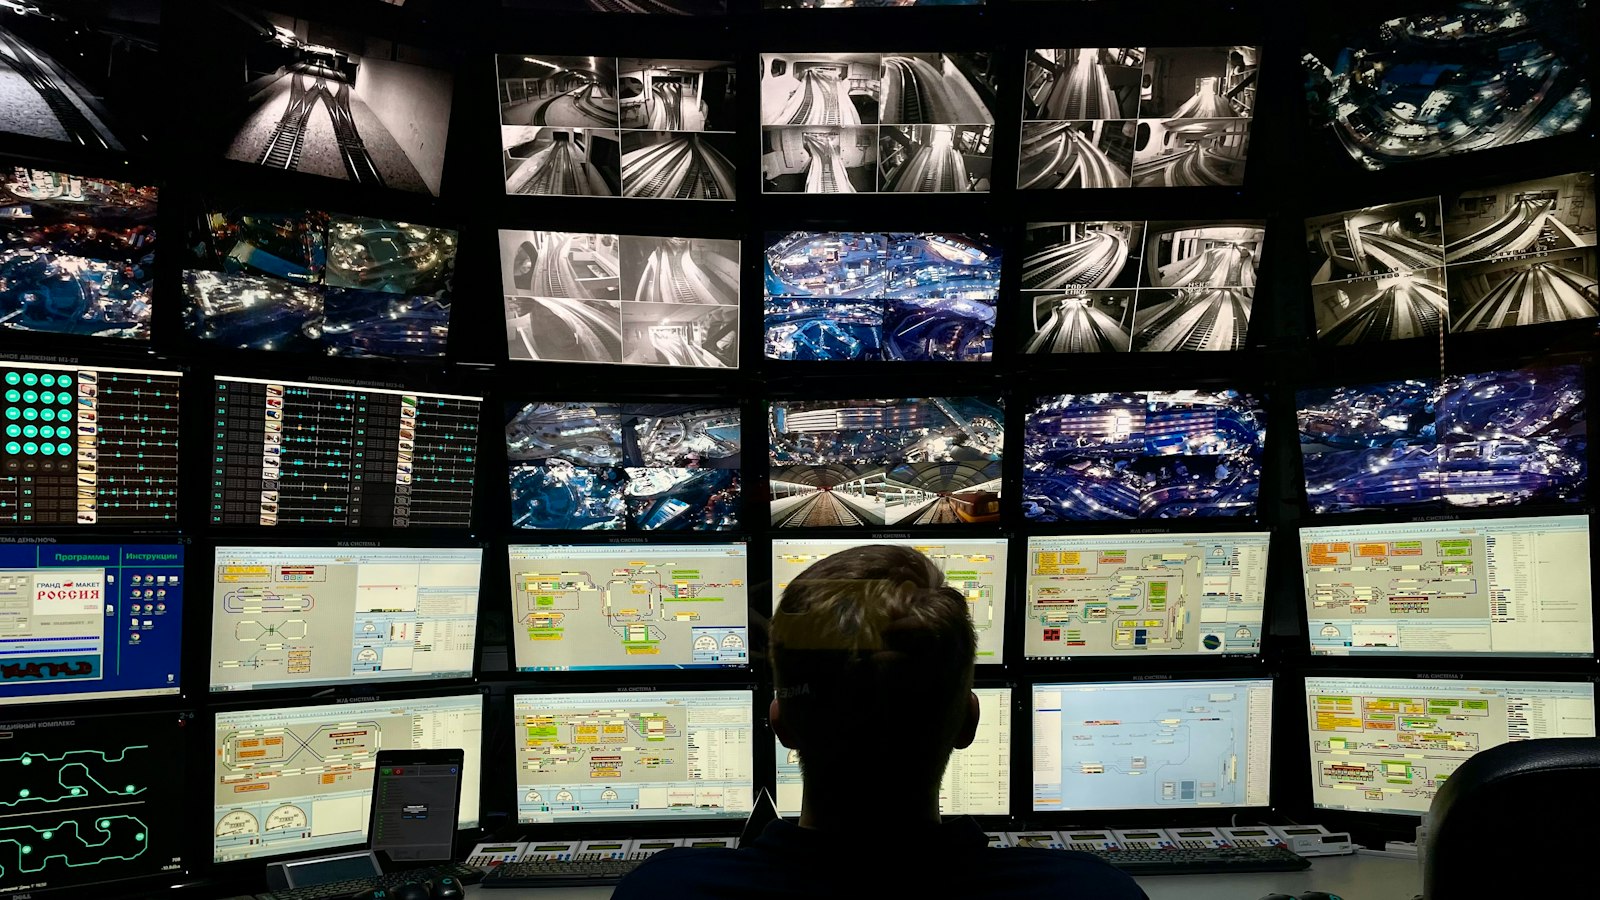
Your LLM app passed the demo. Traffic was light for the first week, and everything looked fine. Then a Friday spike pushed p95 latency from 800ms to 6s, a trickle of 429s turned into a stream, and the monthly token bill doubled — while the team only found out because users complained. That gap between “it works” and “we know it works” is exactly what LLM monitoring closes.
This guide is a production-focused answer to one practical question: what should you actually monitor after an LLM application ships? It is not a general Observability primer. It is a checklist of the signals that catch LLM-specific failures — token spend, TTFT and inter-token latency, provider rate limits, and silent quality regressions — before your users do.
Why Your LLM App Goes Dark After Launch
sequenceDiagram
    participant A as Latency tail blowout.
    participant B as Rate-limit creep.
    participant C as Cost drift.
    A->>B: Request llm monitoring
    B->>C: Execute Why Your LLM App Goes Dark After Launch
    C-->>B: Return llm monitoring status
    B-->>A: Confirm Silent quality drop.
A working demo proves the happy path. It says nothing about what happens under load, across providers, or over a billing cycle. The failure pattern is consistent: the app is fine until volume, concurrency, or a provider-side incident exposes the dimensions nobody instrumented.
The “launched and blind” failure pattern
The symptoms rarely arrive as a single crash. They arrive as a slow drift you can’t see:
- Latency tail blowout. The average stays reasonable while p95 climbs. If you only chart a mean, the users hitting the slow tail are invisible to you.
- Rate-limit creep. 429s appear intermittently, retries pile up, and the retry storm amplifies the original incident.
- Cost drift. Output tokens grow quietly — longer responses, longer context, a prompt change — and the bill arrives before the alert does.
- Silent quality drop. Responses get shorter, truncated, or empty. Nothing errors, but the product got worse.
What this article delivers
A production checklist organized around nine signals: request volume, error rate by type, availability, latency and TTFT, token usage, API cost, provider errors and rate limits, multi-model differences, and quality floor checks — plus alerting and a triage decision tree. Where the underlying theory is large enough to deserve its own treatment, this guide links out rather than repeating it.
What LLM Monitoring Is — and How It Differs from Observability and Tracing
flowchart TD
    S0["Start: llm monitoring"]
    S1["1. The subject"]
    S0 --> S1
    S2["2. These three terms get used interchangea…"]
    S1 --> S2
    S3["3. Monitoring consumes the signals."]
    S2 --> S3
    S4["4. Traditional web services don't have tok…"]
    S3 --> S4
    Done["Outcome: What LLM Monitoring Is — and How It Dif…"]
    S4 --> Done
LLM monitoring is the practice of continuously collecting, analyzing, and acting on signals that track an LLM system’s health against LLM-specific failure modes — token consumption, TTFT and inter-token latency, provider rate limits, and non-deterministic output quality. It answers one question: is the system healthy right now?
Monitoring, Observability, and Tracing are not the same thing
These three terms get used interchangeably, and that causes real instrumentation mistakes. The boundary is worth drawing precisely:
| Dimension | Monitoring | Observability | Tracing |
|---|---|---|---|
| Question it answers | “Is the system healthy now?” | “Why is it behaving this way?” | “What path did this one request take?” |
| Primary artifact | Metrics + thresholds + alerts | A framework spanning metrics, logs, and traces | Distributed spans across a request |
| Time view | Continuous, aggregated, real-time | Exploratory, retrospective | Single request, full path |
| Role in this article | The subject | Linked out — see LLM Observability | Linked out — see LLM Tracing |
Monitoring consumes the signals. Observability is the higher-level framework that produces them — OpenTelemetry describes itself as a vendor-neutral open source observability framework built on metrics, logs, and traces. Tracing is one of those signal types, not a synonym for monitoring. If you want the full definition of the framework layer, read the dedicated LLM Observability guide; if you want per-request path analysis, start with LLM Tracing.
Why LLMs need dedicated monitoring
Traditional web services don’t have tokens, TTFT, or provider-side rate limits. LLM systems do, and the standard vocabulary for recording them is still maturing. The OpenTelemetry GenAI semantic conventions define vendor-neutral fields for LLM calls across providers including OpenAI, Anthropic, AWS Bedrock, and Azure AI Inference [5]. Adopting those conventions early keeps your monitoring portable instead of locked to one SDK’s naming.
Baseline Health: Request Volume, Error Rate, and Availability
Before anything LLM-specific, you need the three signals that tell you whether the service is up and serving. The trap is collapsing them into single numbers.
Request volume — split it, don’t total it
A single global request counter tells you almost nothing. Split volume by endpoint, by model, and by tenant. That split is what lets you answer “did total traffic rise, or did one customer’s batch job spike?” A blended counter hides both.
Error rate by type — never one blended ratio
A single error-rate percentage merges failures you must handle differently. Classify them:
- 429 — you hit a rate limit (RPM, RPD, or TPM). The response body carries a
ratelimiterrortype identifying which limit was hit, and you should back off exponentially with jitter and honor theRetry-Afterheader [4]. - 4xx (non-429) — a request problem: bad key, bad payload, invalid parameters. Retrying won’t help until you fix the cause.
- 5xx — a provider-side problem. These are not your request’s fault and typically resolve within minutes; if they persist beyond five minutes, check the provider’s status page [4].
- Timeout — a distinct class that often signals queueing or provider degradation rather than a hard failure.
Availability — and why you must self-probe
Provider status pages are reactive. OpenAI’s status page, for example, often lags real incidents by 15–30 minutes, and 500 errors during an incident can persist for 30–90 minutes [4]. If you trust the status page as your availability signal, you will always be the last to know.
Run synthetic probes instead. A low-cost, effective check is pinging a lightweight endpoint such as /v1/models on a 60-second interval — it exercises the auth chain and gives you a detection window measured in seconds, not tens of minutes [4]. Probe every provider you depend on, independently.
Latency and TTFT: Measuring the Tail, Not the Average
Track p50, p95, and p99 separately, and decompose a completion into its stages. A healthy median with an ugly p95 points at queueing or batching — not the model. The average hides the tail, and users feel the tail.
Decompose a single completion into stages
A completion is not one timer. It is at least four independent stages:
- Network and queueing — time before the model starts working.
- TTFT (time to first token) — from query submission to the first token, including request queuing, prefill, and network latency. Longer prompts increase TTFT because the attention mechanism must build the KV cache from the full input before generation begins [1].
- Inter-token latency (ITL) — the average gap between consecutive output tokens, also called time per output token (TPOT). NVIDIA defines it as
(e2e latency − TTFT) / (output tokens − 1), deliberately excluding the first token [1][6]. - Detokenization and response transfer — assembling and shipping the result back.
End-to-end latency is the sum: e2e = TTFT + generation time, and generation time scales with output tokens, so latency = TTFT + TPOT × tokens generated [1][2]. For the full principles behind each stage, read the dedicated LLM Latency guide.
Track percentiles, not means
A healthy p50 with a degraded p95 is a queueing or batching story, not a model story [3]. Chart p50, p95, and p99 as separate series so the tail is visible the moment it moves. When you tune for the median, you often hurt the tail — so profile first, then fix the stage that owns the largest share of your p95.
Streaming smoothness via ITL
For streaming interfaces, TTFT is only half the experience. ITL determines the perceived smoothness of a streamed response — the gap between tokens is what users feel as “fast” or “sluggish,” especially in voice interfaces and long streaming outputs [6]. Monitor ITL at p95 and p99, not just on average. Production observability stacks commonly track request-level TPOT, p95 TTFT, and p99 inter-token latency as distinct series with their own alert runbooks [3]. For a deeper treatment of TTFT specifically, see the TTFT guide.
Token Usage and API Cost: Controlling the Bill Before It Doubles
Count input and output tokens separately, and monitor cost as a rate — dollars per hour — not a monthly total. A monthly total is a post-mortem; a rate is a signal.
Token usage — split input from output
Every response reports its token consumption, so there is no excuse for a single blended token number. Track input tokens and output tokens as separate series. They have different cost structures and different failure modes: input growth usually means context bloat, while output growth usually means runaway generation.
API cost as a rate, not a monthly total
The cost formula is simple and worth instrumenting directly:
“ cost = (input tokens × input price) + (output tokens × output price) “
Prices are quoted per million tokens, and output token pricing is typically 3–5× input token pricing across major providers [7]. That asymmetry is the whole reason to monitor cost continuously: a modest rise in output length has an outsized effect on spend. Chart $/hour so a spike surfaces within the hour, not at the end of the billing cycle. For current per-model rates, see the LLM API Pricing reference.
Runaway output risk
Because output tokens cost 3–5× input tokens, an unbounded generation is an unbounded bill [7]. Set max_tokens per request as a hard ceiling, and alert when output token rate trends up. A prompt change that nudges average response length is invisible in a monthly total but obvious in a $/hour chart.
Provider Errors, Rate Limits, and Multi-Model Monitoring Differences
Track provider errors and rate limits by unit, and measure your failover success rate. The moment you depend on more than one provider, the differences between their error semantics and limit units become a monitoring problem of their own.
Model and provider errors, and failover
500/503 responses are provider-side issues that usually clear in minutes; sustained errors should trigger fallback to an alternate provider such as Claude or Gemini [4]. That fallback is only as good as its instrumentation — track your failover strategy and the switch success rate. A failover that silently fails is worse than no failover, because it hides the outage behind a degraded experience.
Rate limits by unit
Rate limits are enforced on different units, and you must alert on them separately:
- RPM — requests per minute
- TPM — tokens per minute
- RPD — requests per day
OpenAI’s tiers illustrate the scale: from 3 RPM on the free tier up to 10,000 RPM and 30M TPM on Tier 5, with limits varying by model [4]. A single “rate limit hit” counter conflates three different problems with three different fixes. Split them.
Multi-model environments
Provider error semantics, limit units, and failover behavior all differ across models and vendors. Unify them behind an abstraction layer and a shared error vocabulary so your dashboards and alerts speak one language. The OpenTelemetry GenAI conventions exist precisely so you can record LLM calls with consistent, vendor-neutral fields instead of per-provider one-offs [5].
Response Quality Monitoring: Where the Boundary Sits
Monitoring detects regressions; it does not score quality. Keep response quality monitoring to the automatable floor checks, and leave evaluation metrics to a dedicated evaluation workflow.
Automatable floor checks only
These are the quality signals a monitoring system can and should own:
- Empty responses — a completion that returns no content.
- Truncation — output cut off by a token limit or an interrupted stream.
- Schema failures — structured output that fails to parse.
- Refusal rate — an unexpected rise in refusals.
- Latency anomalies — response time spikes that correlate with quality complaints.
Keep evaluation metrics out of monitoring
Scoring helpfulness, correctness, or faithfulness is an evaluation activity with its own tooling, datasets, and cadence. Mixing evaluation metrics into your monitoring dashboards blurs the line between “is it healthy?” and “is it good?” and makes both harder to act on. Monitoring’s job is to catch the regression and hand off to evaluation when the signal warrants it.
Alerting and anomaly detection
Single-point thresholds generate noise. Use multi-dimensional thresholds that combine a percentile, an error type, and a cost rate:
- Latency alert: p95 or p99 crosses a threshold, not the mean.
- Error alert: 429 rate and 5xx rate are separate rules, because they need opposite responses [4].
- Cost alert:
$/hourexceeds a rate ceiling, not a monthly total.
Combining dimensions cuts false positives and makes each alert actionable.
Practical Application and Action Guide for llm monitoring
Here is where the nine signals turn into something you can wire up this week.
Scenario comparison matrix
Different products weight the signals differently. Prioritize accordingly:
| Business scenario | Primary signals | Secondary signals | Can relax |
|---|---|---|---|
| Real-time chat / voice | TTFT, ITL (p95/p99) | Error rate, 429 | Cost (small per call) |
| Batch content generation | Cost rate, token usage | Throughput, 5xx | TTFT (non-interactive) |
| Multi-model routing gateway | Per-provider error rate, rate-limit hits | Failover success rate | Single-model latency |
| High-value / paid user paths | End-to-end tail latency, availability | Quality floor checks | Global averages |
Pre-launch monitoring checklist
Instrument these before you ship:
- [ ] Request volume split by endpoint / model / tenant
- [ ] Error rate split by type (429 / 4xx / 5xx / timeout)
- [ ] Latency tracked at p50 / p95 / p99, with TTFT and ITL separated
- [ ] Token usage split into input and output
- [ ] API cost tracked as
$/hour, not just a monthly total - [ ] Per-provider synthetic availability probes (e.g., every 60s)
- [ ] Rate-limit alerts split by RPM / TPM / RPD
- [ ] Failover success rate metric
- [ ] Quality floor checks (empty / truncation / schema failure / refusal rate)
- [ ] Multi-dimensional alert thresholds (percentile + error type + cost rate)
Anomaly triage decision tree
When something moves, triage in this order:
- Latency up → check p95/p99 first. If the median is normal and only the tail moved, look at queueing, batching, or rate limiting — not the model.
- Errors up → separate 429 (your rate limit; back off and smooth traffic) from 5xx (provider side; fail over) [4].
- Cost spike → check output token rate first (3–5× input pricing), then check whether
max_tokensis set [7]. - Quality drop → rule out the automatable signals (empty responses, truncation, schema failures) before opening an evaluation investigation.
Core Takeaways and Next Steps
Core conclusion
LLM monitoring answers “is the system healthy now?” It consumes signals rather than replacing Observability, and it is defined by LLM-specific failure modes: tokens, TTFT and ITL, provider rate limits, and non-deterministic output quality. Get those nine signals instrumented, split them correctly, and alert on combinations rather than single points.
Next steps
Instrument the nine signals, wire up multi-dimensional alerts, and run the pre-launch checklist against your own stack. For the deeper theory behind each area, continue with the related guides: LLM Observability for the framework layer, LLM Tracing for per-request path analysis, LLM Latency for the full latency breakdown, TTFT for first-token specifics, and LLM API Pricing for current per-model rates.
CTA
Ready to instrument it? Read the docs to get started, or explore models to compare what you’re running in production.
FAQ
Q: What is LLM monitoring in one sentence?
A: LLM monitoring is the continuous collection, analysis, and use of signals that track an LLM system’s health against LLM-specific failure modes — token consumption, TTFT and inter-token latency, provider rate limits, and non-deterministic output quality.
Q: How is LLM monitoring different from Observability and Tracing?
A: Monitoring answers “is the system healthy now?” using metrics, thresholds, and alerts. Observability is the higher-level framework that produces metrics, logs, and traces — OpenTelemetry describes itself as a vendor-neutral observability framework. Tracing is one signal type within it, capturing the path a single request takes. Monitoring consumes those signals; it does not replace them.
Q: Which latency metric matters most — TTFT or total latency?
A: Both, and separately. TTFT governs perceived responsiveness for interactive and streaming apps, while end-to-end latency governs completion time. Track p50, p95, and p99 for each. A healthy median with a degraded p95 usually points to queueing or batching rather than the model itself.
Q: Should I monitor cost monthly or continuously?
A: Continuously, as a rate. Track $/hour so a spike surfaces within the hour rather than at the end of the billing cycle. Because output tokens typically cost 3–5× input tokens, a small rise in output length can have an outsized effect on spend.
Q: Why self-probe provider availability instead of trusting status pages?
A: Provider status pages are reactive. OpenAI’s status page, for example, often lags real incidents by 15–30 minutes, and 500 errors during an incident can persist for 30–90 minutes. Synthetic probes — such as pinging /v1/models every 60 seconds — give you a detection window measured in seconds.
Q: Does response quality monitoring belong in monitoring?
A: Only the automatable floor checks: empty responses, truncation, schema failures, refusal rate, and latency anomalies. Scoring helpfulness or correctness is an evaluation activity with its own workflow. Monitoring detects the regression; evaluation explains it.
Q: How do I handle rate limits across multiple providers?
A: Alert on each unit separately — RPM, TPM, and RPD — because each needs a different fix. Read the Retry-After header, back off exponentially with jitter, and track failover success rate so a silent failover doesn’t hide an outage behind a degraded experience.
References
1] [NVIDIA NIM LLMs Benchmarking — Metrics — Defines TTFT, end-to-end latency, and inter-token latency (ITL/TPOT), including the formula ITL = (e2e latency − TTFT) / (output tokens − 1) and the note that TTFT includes queueing, prefill, and network latency.
2] [Databricks — LLM Inference Performance Engineering: Best Practices — Provides the latency decomposition latency = TTFT + (TPOT × number of tokens to be generated) and throughput definitions.
3] [DEV Community — Monitor LLM Inference in Production: Prometheus & Grafana — Recommends tracking p50/p95/p99 request duration, prefill vs decode latency, and inter-token latency as a production metrics checklist.
4] [API Status Check — OpenAI API Monitoring Guide 2026 — Documents OpenAI rate-limit tiers (3 RPM → 30M TPM), status-page lag of 15–30 minutes, 500 errors lasting 30–90 minutes, 60-second /v1/models synthetic probing, 429 ratelimiterror semantics, Retry-After, and failover guidance.
5] [OpenTelemetry — Generative AI semantic conventions — Provides vendor-neutral semantic conventions for recording GenAI/LLM calls across providers (OpenAI, Anthropic, AWS Bedrock, Azure AI Inference).
6] [Infercom — What is Inter-Token Latency (ITL)? TPOT Explained — Defines inter-token latency / time per output token and its role in determining the perceived smoothness of streamed output.
7] [Finout — LLM Token Cost by Model: 2026 Pricing Data — Reports that output token pricing is typically 3–5× input token pricing and provides the per-million-token cost structure.